Table of Contents
KPI Intelligence Engine
InfotoIntell's Reasoning & Insight System
نظام الاستدلال والرؤى من InfotoIntell
User Guide & Reference Manual
Build the semantic layer once. Apply AI-powered KPI diagnostics, anomaly detection, and causal analysis to any business.
by InfotoIntell
Use arrow keys or click corners to navigate →
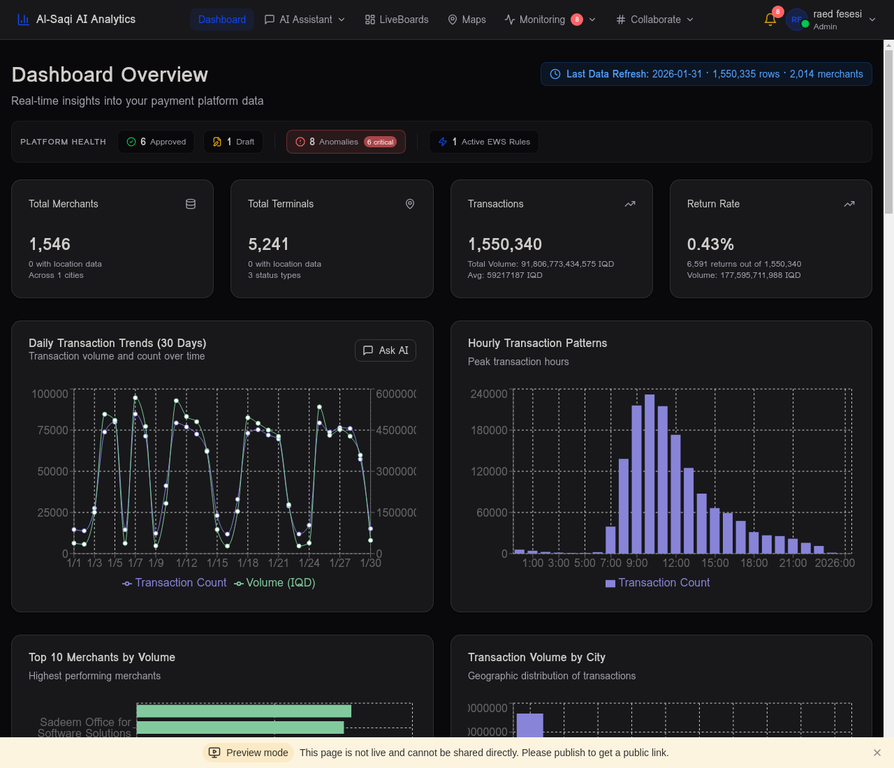
Platform Overview
The KPI Intelligence Engine is a domain-agnostic analytics platform by InfotoIntell. It combines a business-owned semantic layer, AI-powered diagnostics, and an early warning system (EWS) into a single unified workspace — deployable across any industry once the semantic layer is built with your team.
KPI List View
The List View is your KPI registry. Switch to it from the KPI Designer using the view toggle in the top toolbar.
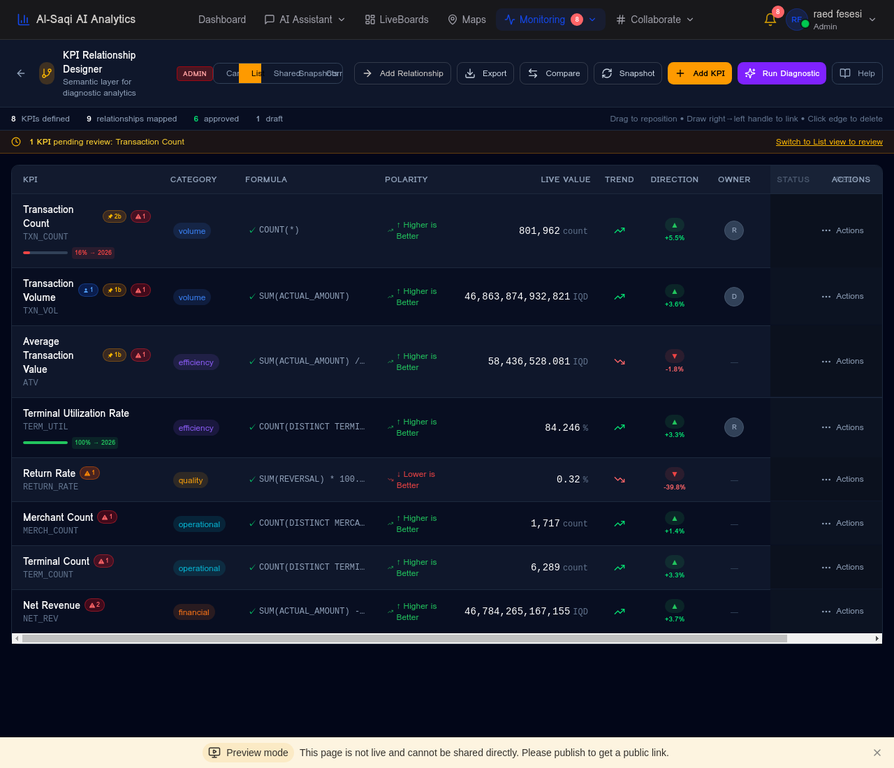
- + Create a new KPI using the + New KPI button
- ✏ Edit any KPI by clicking its row to open the detail panel
- 🗑 Delete a KPI (only if it has no active relationships)
- 🔍 Search and filter by domain, status, or data type
- 📋 See approval status: Draft → Pending → Approved
Creating a KPI — Core Fields
Click + New KPI in the List View. Fill in the required fields:
Creating a KPI — Data & Targets
SUM(AMOUNT) - SUM(REFUND)COUNT(RETURNS) / COUNT(TXN_ID) * 100SUM(AMOUNT) / COUNT(TXN_ID)Approval Workflow
Every KPI must be reviewed and approved before it is used in analytics. This ensures data governance and prevents unvalidated metrics from influencing decisions.
Approval Inbox
Navigate to KPI Approval Inbox from the sidebar. This is where reviewers see all pending requests and cast their votes.
- ✓ Approve — Vote to approve the KPI definition
- ✗ Reject — Vote to reject with a mandatory comment
- 💬 Comment — Add a review comment without voting
- 👁 Preview — View the KPI definition and formula before voting
The Approval Canvas shows all KPIs in a visual board grouped by status. Drag-and-drop to move KPIs between stages, or use it as a read-only overview of the pipeline.
Canvas View
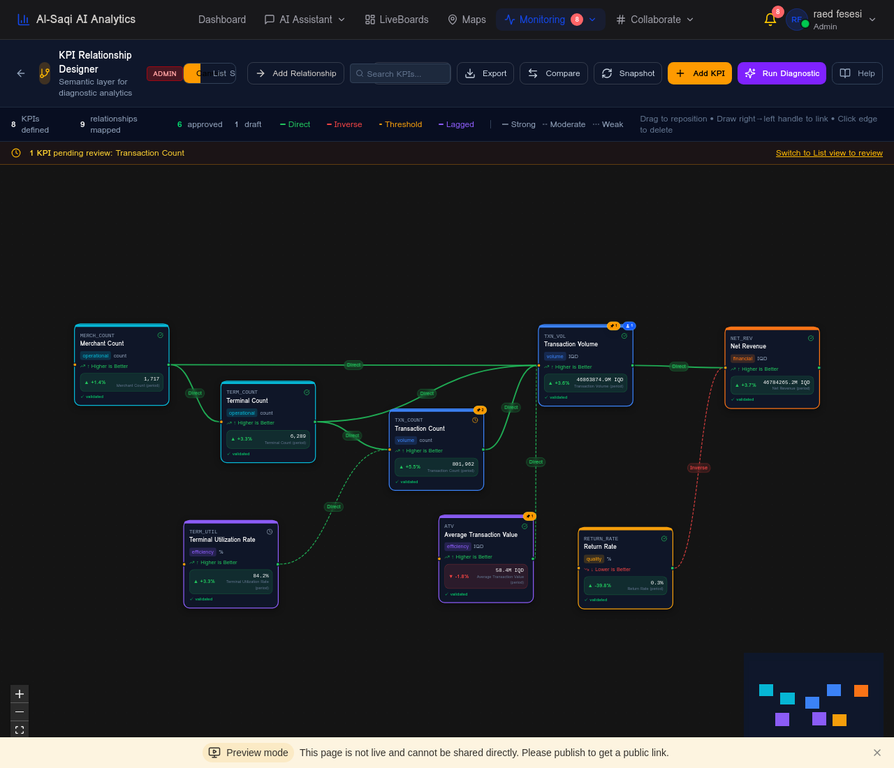
The Canvas is a visual graph of all approved KPIs and the relationships between them. It is the foundation for diagnostics and root cause analysis.
- • Scroll to zoom in/out
- • Drag empty space to pan
- • Click a KPI node to select it and see its details
- • Search using the search bar to highlight matching KPIs
Filtering Edges
The legend at the bottom of the canvas is interactive. Click any relationship type to highlight only those edges and dim all others.
- Click Direct, Inverse, Threshold, or Lagged in the legend
- All other edge types dim to 10% opacity
- The active filter shows a colored dot indicator
- Click clear (appears next to the active item) to reset
- Click the same item again to toggle it off
Drawing New Edges
You can manually draw relationships between KPIs directly on the canvas to encode domain knowledge.
- Click a KPI node to select it
- Click Add Relationship in the side panel
- Select the target KPI, relationship type, strength, and optional lag
- The strength selector shows a live SVG preview of the line style
KPI Diagnostics
When a KPI moves unexpectedly, the Diagnostic engine explains why. It combines two evidence sources: the human-drawn relationship graph and statistically discovered Pearson r correlations.
Running a Diagnostic
There are two ways to start a diagnostic:
- Click a KPI node in the Canvas
- Click Run Diagnostic in the side panel
- Select the time period (month/quarter)
- The AI runs and opens the Diagnostic page
- Find a KPI with an unexpected movement
- Click the 🔍 Diagnose button on the KPI card
- The diagnostic runs for that period automatically
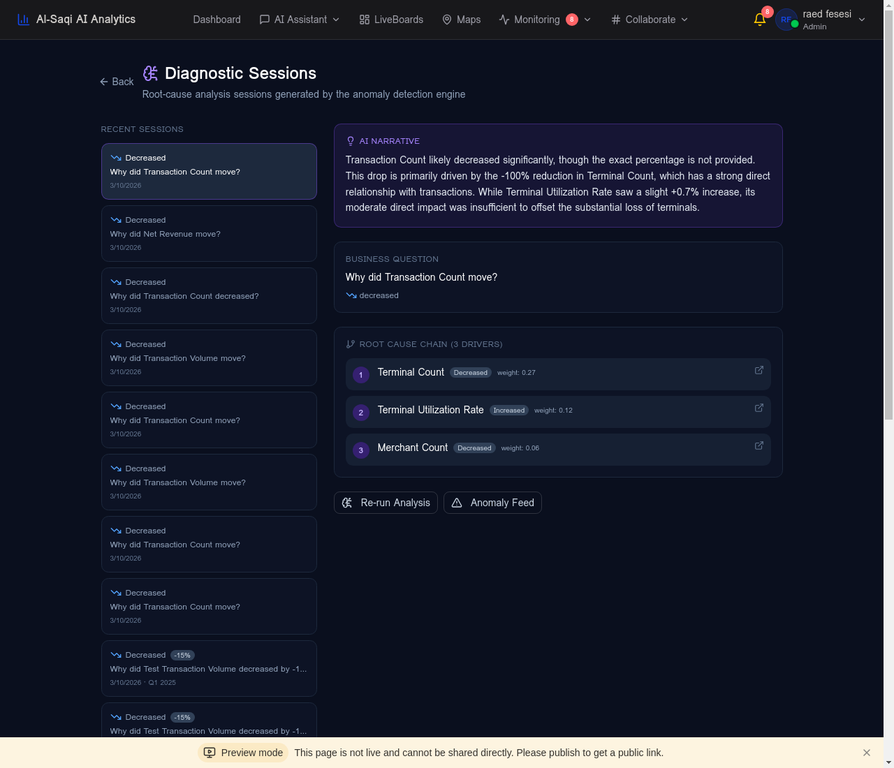
Reading Diagnostic Results
Once the AI completes the analysis, the Diagnostic page shows four key sections:
Anomaly Detection
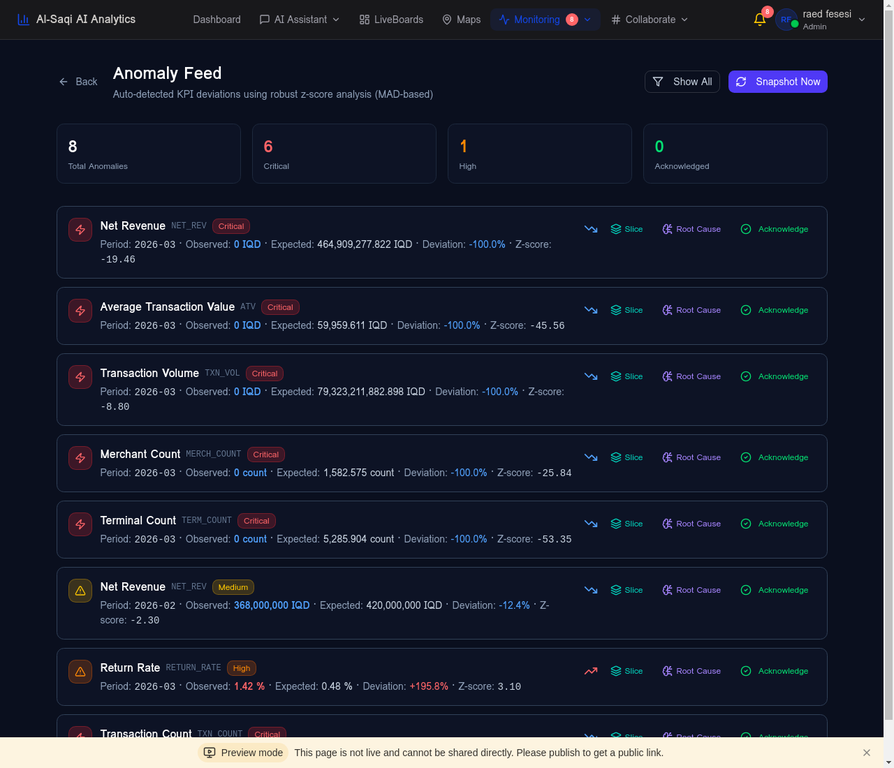
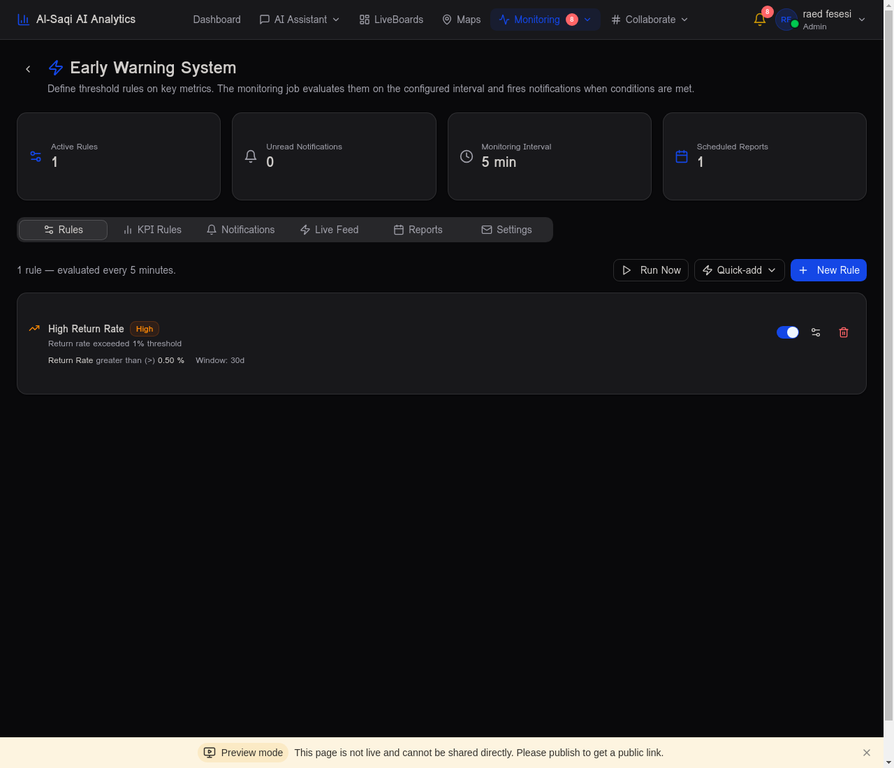
The platform detects two types of anomalies in KPI time series: statistical outliers (values far from the historical distribution) and trend breaks (sudden changes in direction or velocity).
Values more than 2 standard deviations from the rolling mean are flagged as anomalies. Shown as orange markers on the KPI trend chart.
A machine learning model trained on historical KPI snapshots. Detects multi-dimensional anomalies that Z-score alone would miss.
User-defined threshold rules (e.g. "Return Rate > 0.5%") that fire alerts in real time. Configure in the EWS Rules section of KPI Designer.
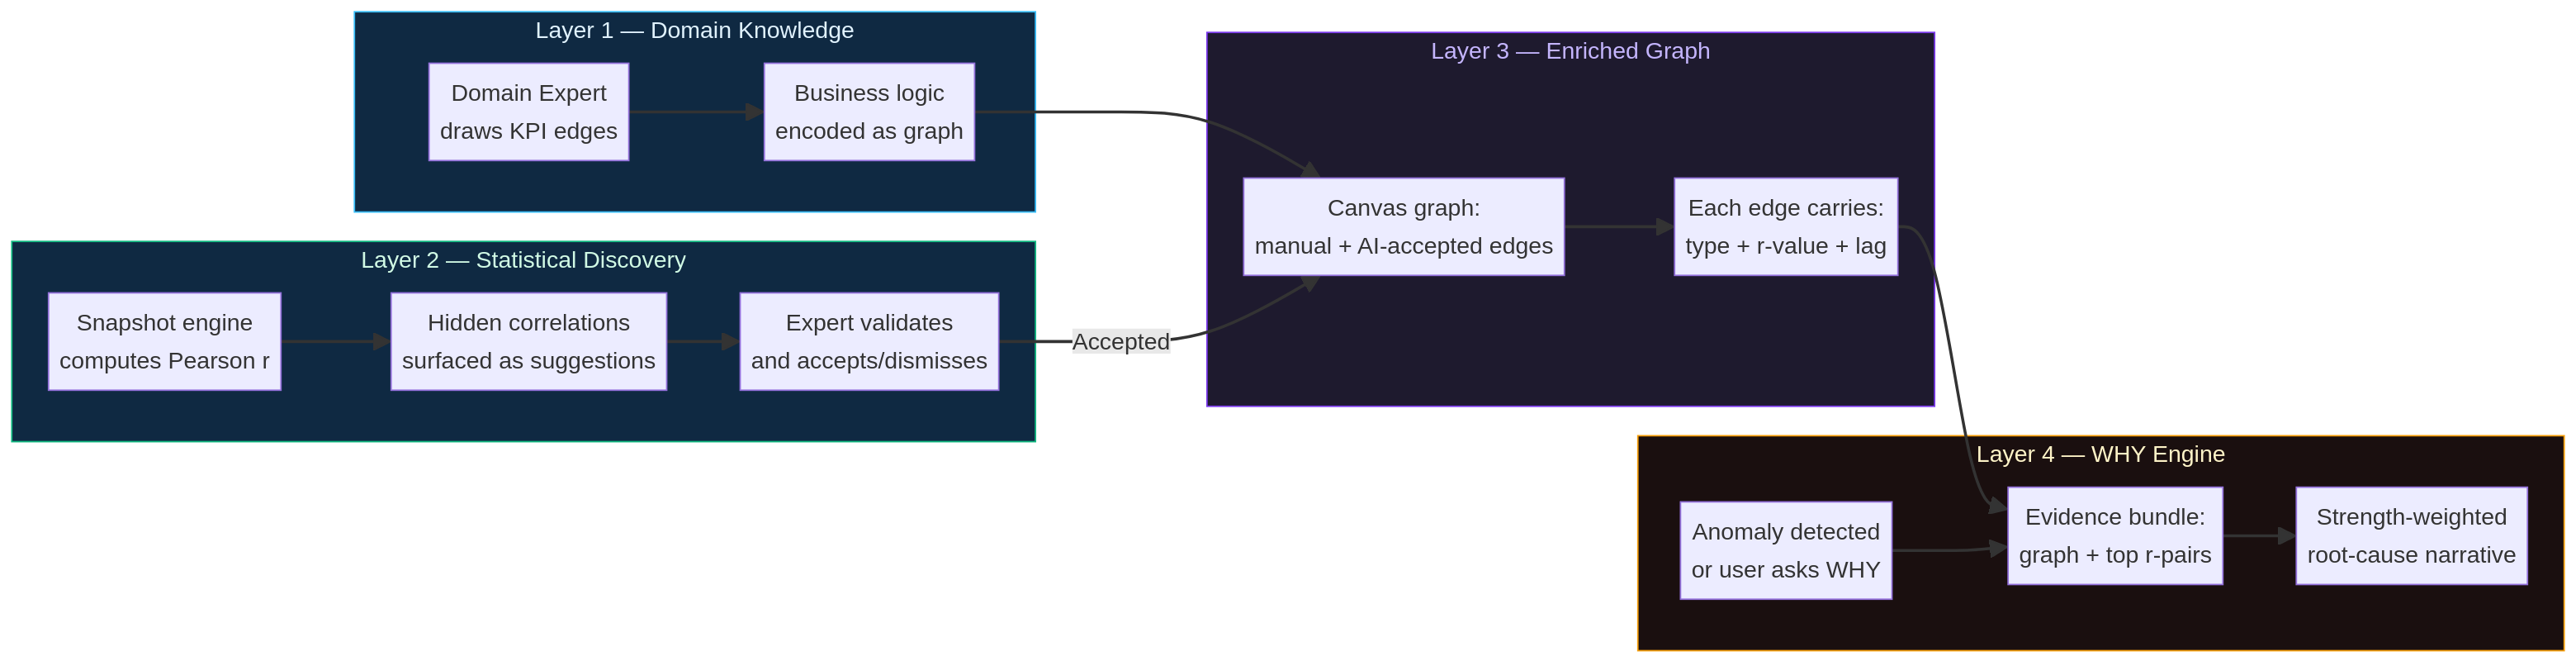
Manual KPI Linking
Domain experts — people who know the business — draw edges between KPIs directly on the Canvas. This encodes institutional knowledge: “when TXN_VOL rises, Net Revenue follows.”
- Click a source KPI node on the Canvas
- Click Add Relationship in the side panel
- Choose the target KPI, edge type, strength, and optional lag
- Click Save — the edge appears immediately
Limits of Manual Linking
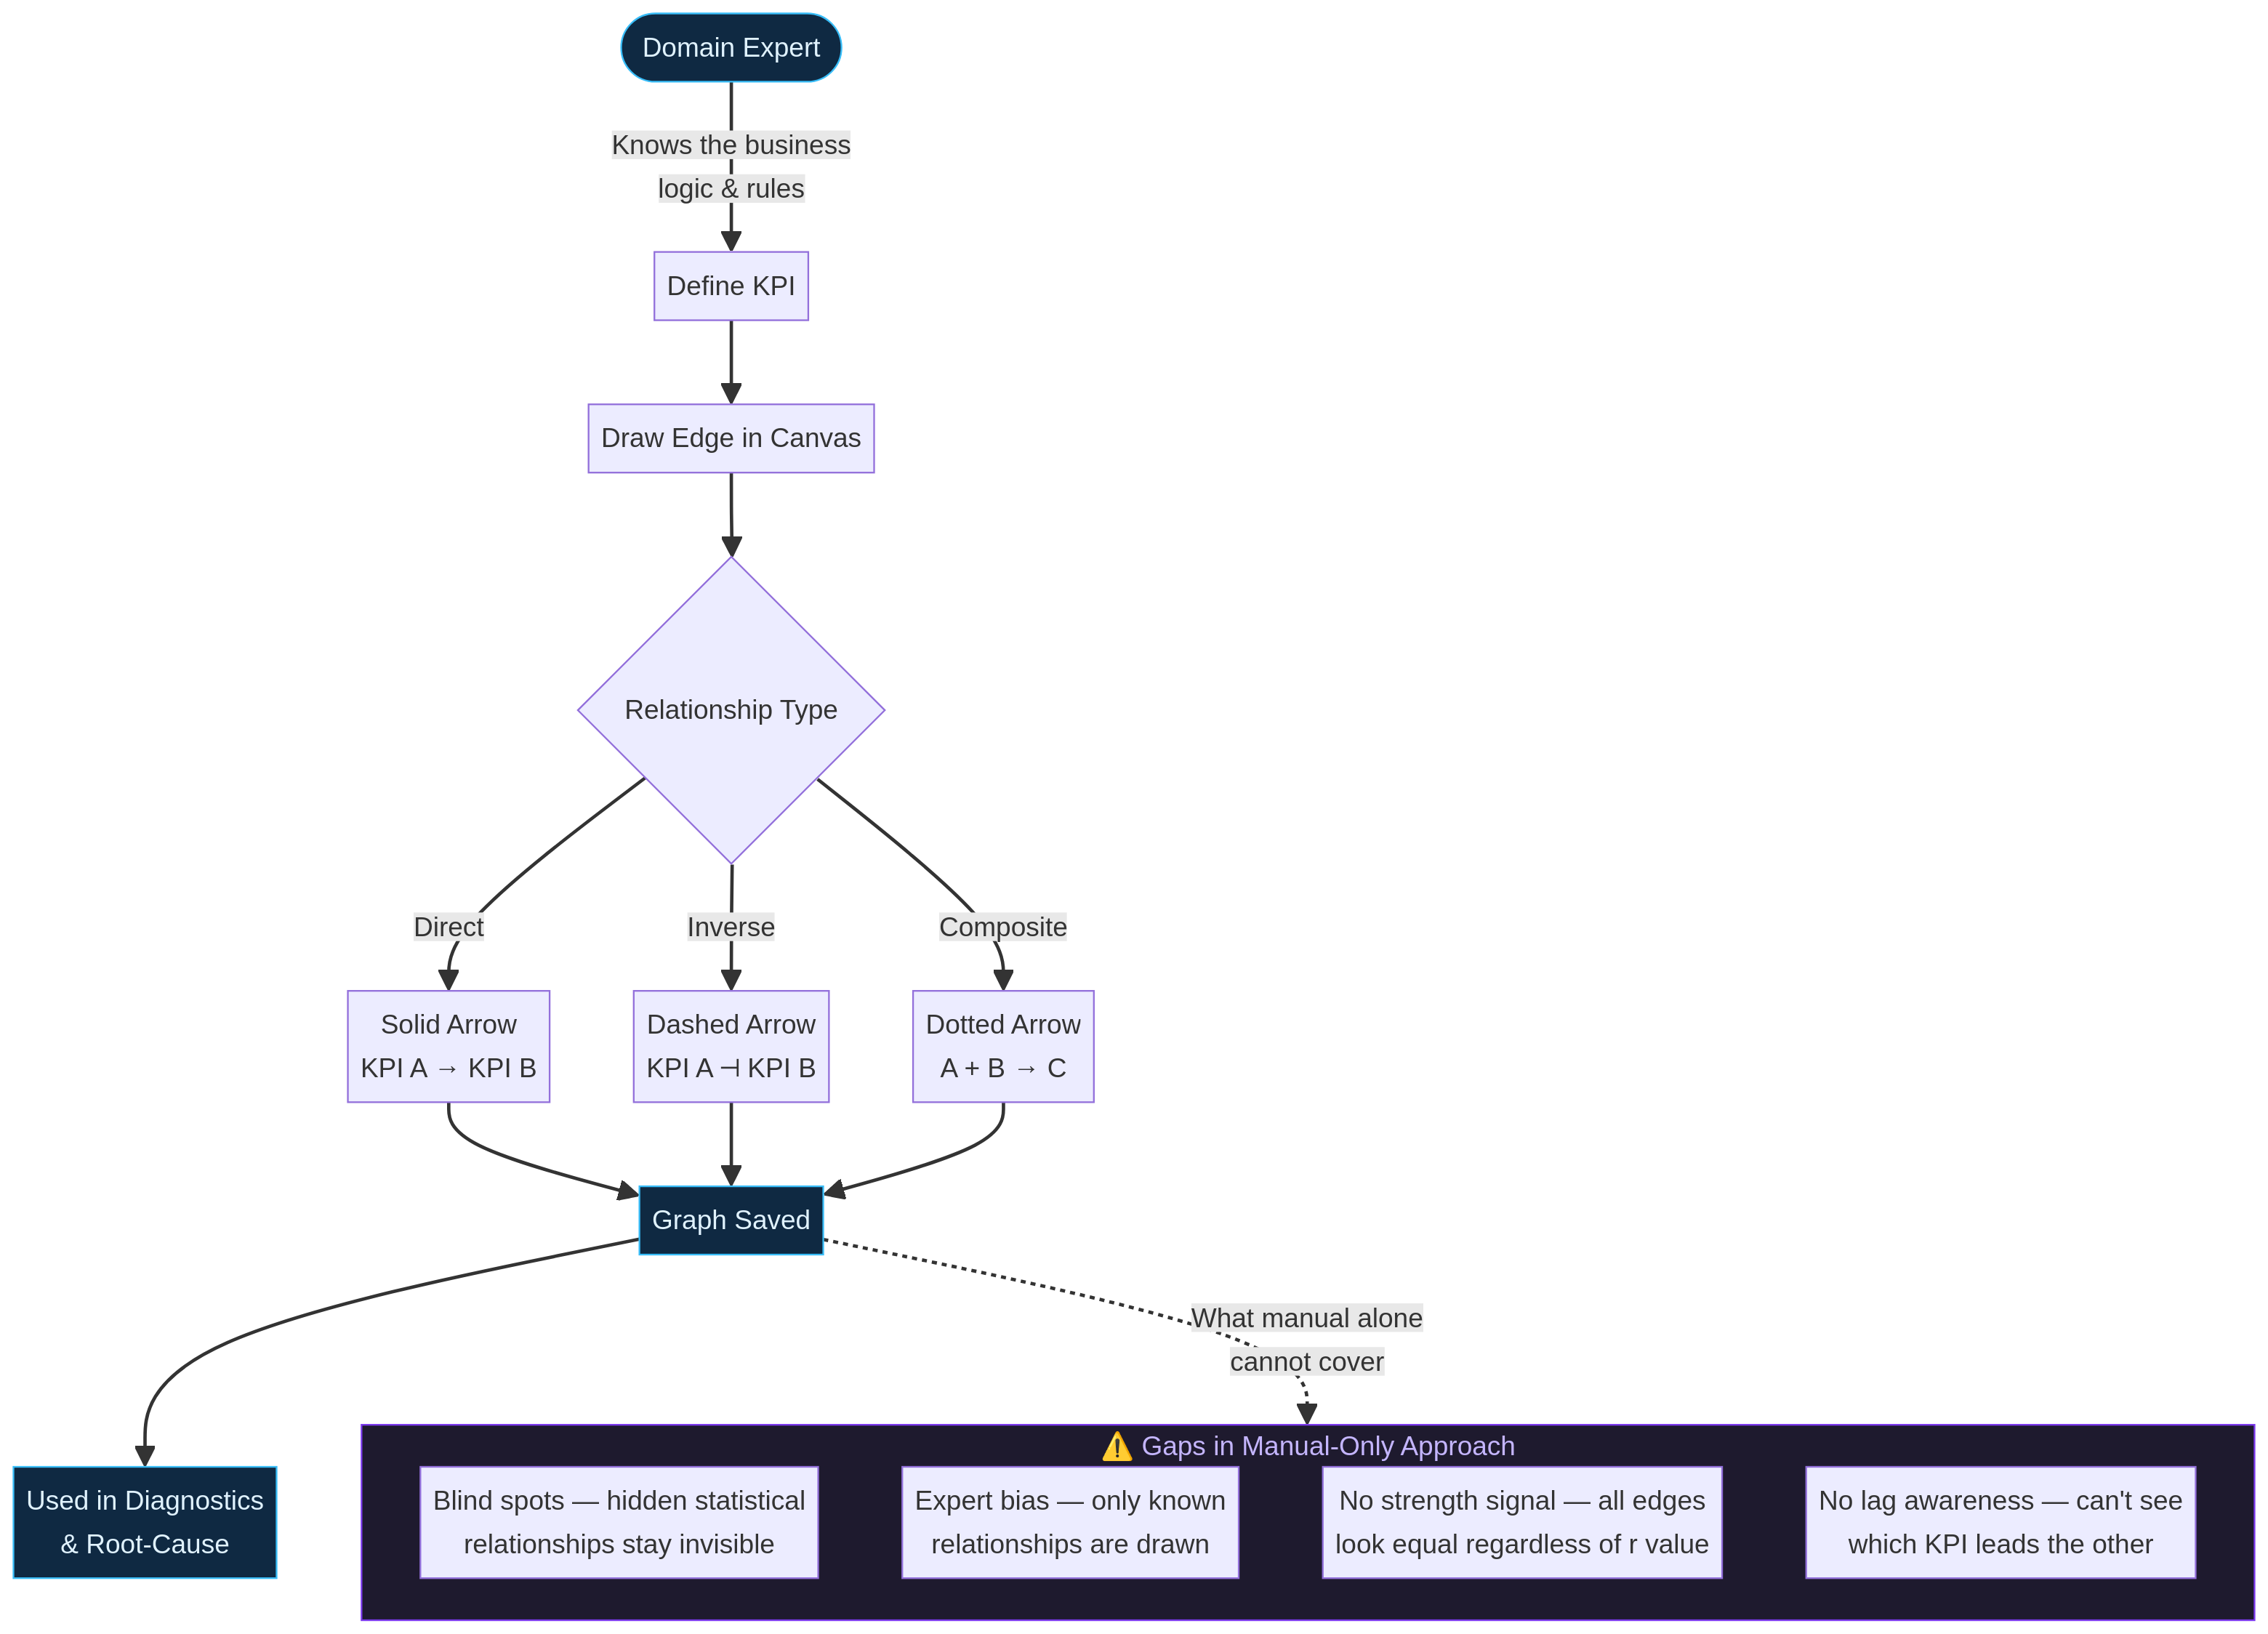
Manual linking captures what experts already know. It cannot surface hidden statistical patterns, does not carry a strength signal (all edges look equal), and has no lag awareness — so it cannot tell you which KPI leads the other in time.
AI Statistical Discovery
Every month the Snapshot engine computes Pearson r for every KPI pair at lag 0–3 months. Pairs with |r| > 0.6 that have no existing edge are surfaced as pending suggestions — ready for a domain expert to validate.
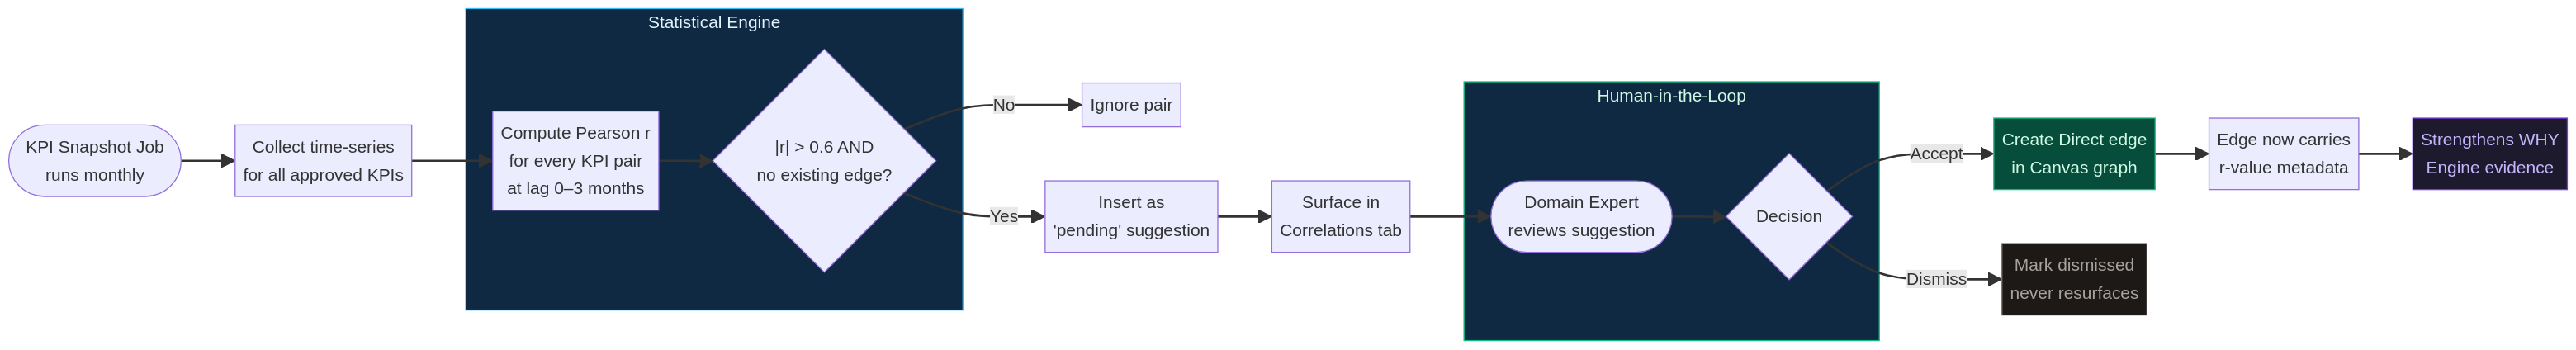
Creates a Direct edge in the Canvas. The edge carries the r-value and lag as metadata — visible in diagnostics.
Marks the pair as dismissed. It will not resurface in future Snapshot runs.
Where: KPI Designer → Correlations tab → AI-Discovered Relationships section below the heatmap.
Correlation Matrix
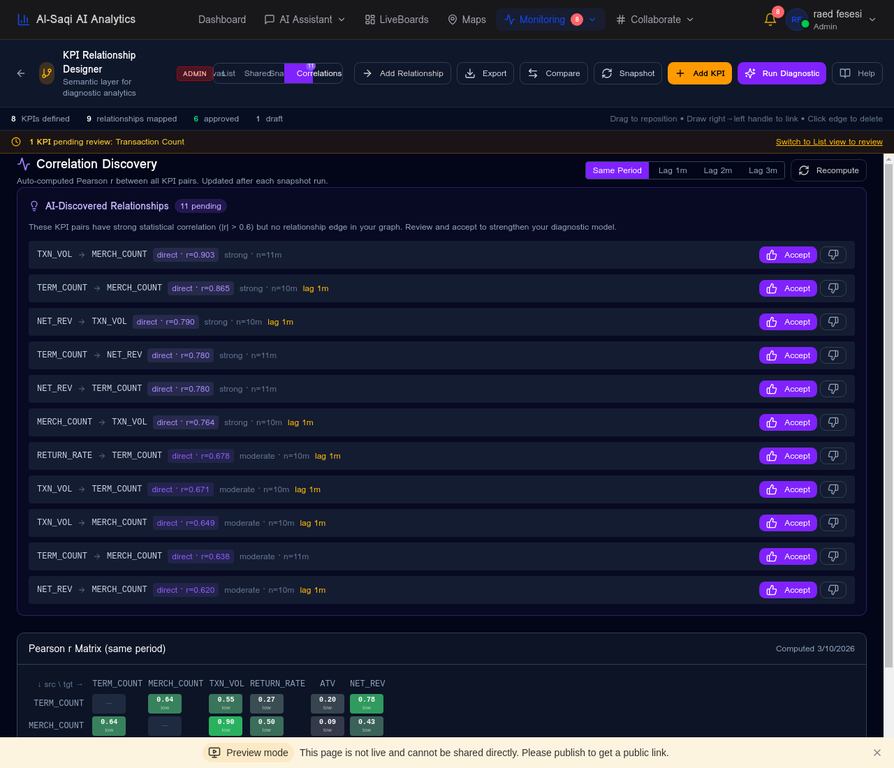
- ■ Green = r ≥ 0.75 (strong positive)
- ■ Red = r ≤ −0.75 (strong negative)
- ■ Grey = weak / no correlation
- Confidence: low 6–23m · moderate 24–35m · high 36m+
r at lag 2 means KPI A predicts KPI B two months later — a leading indicator.
Click any cell → r per city/type. Orange bars = Simpson's Paradox (sign flips vs. aggregate).
The WHY Engine
When a KPI moves unexpectedly — or you ask "Why did Net Revenue drop?" — the WHY Engine assembles evidence from two sources: the Canvas graph (manual + AI-accepted edges) and the top 3 Pearson r pairs from the statistical layer, even if they are not yet in the graph.
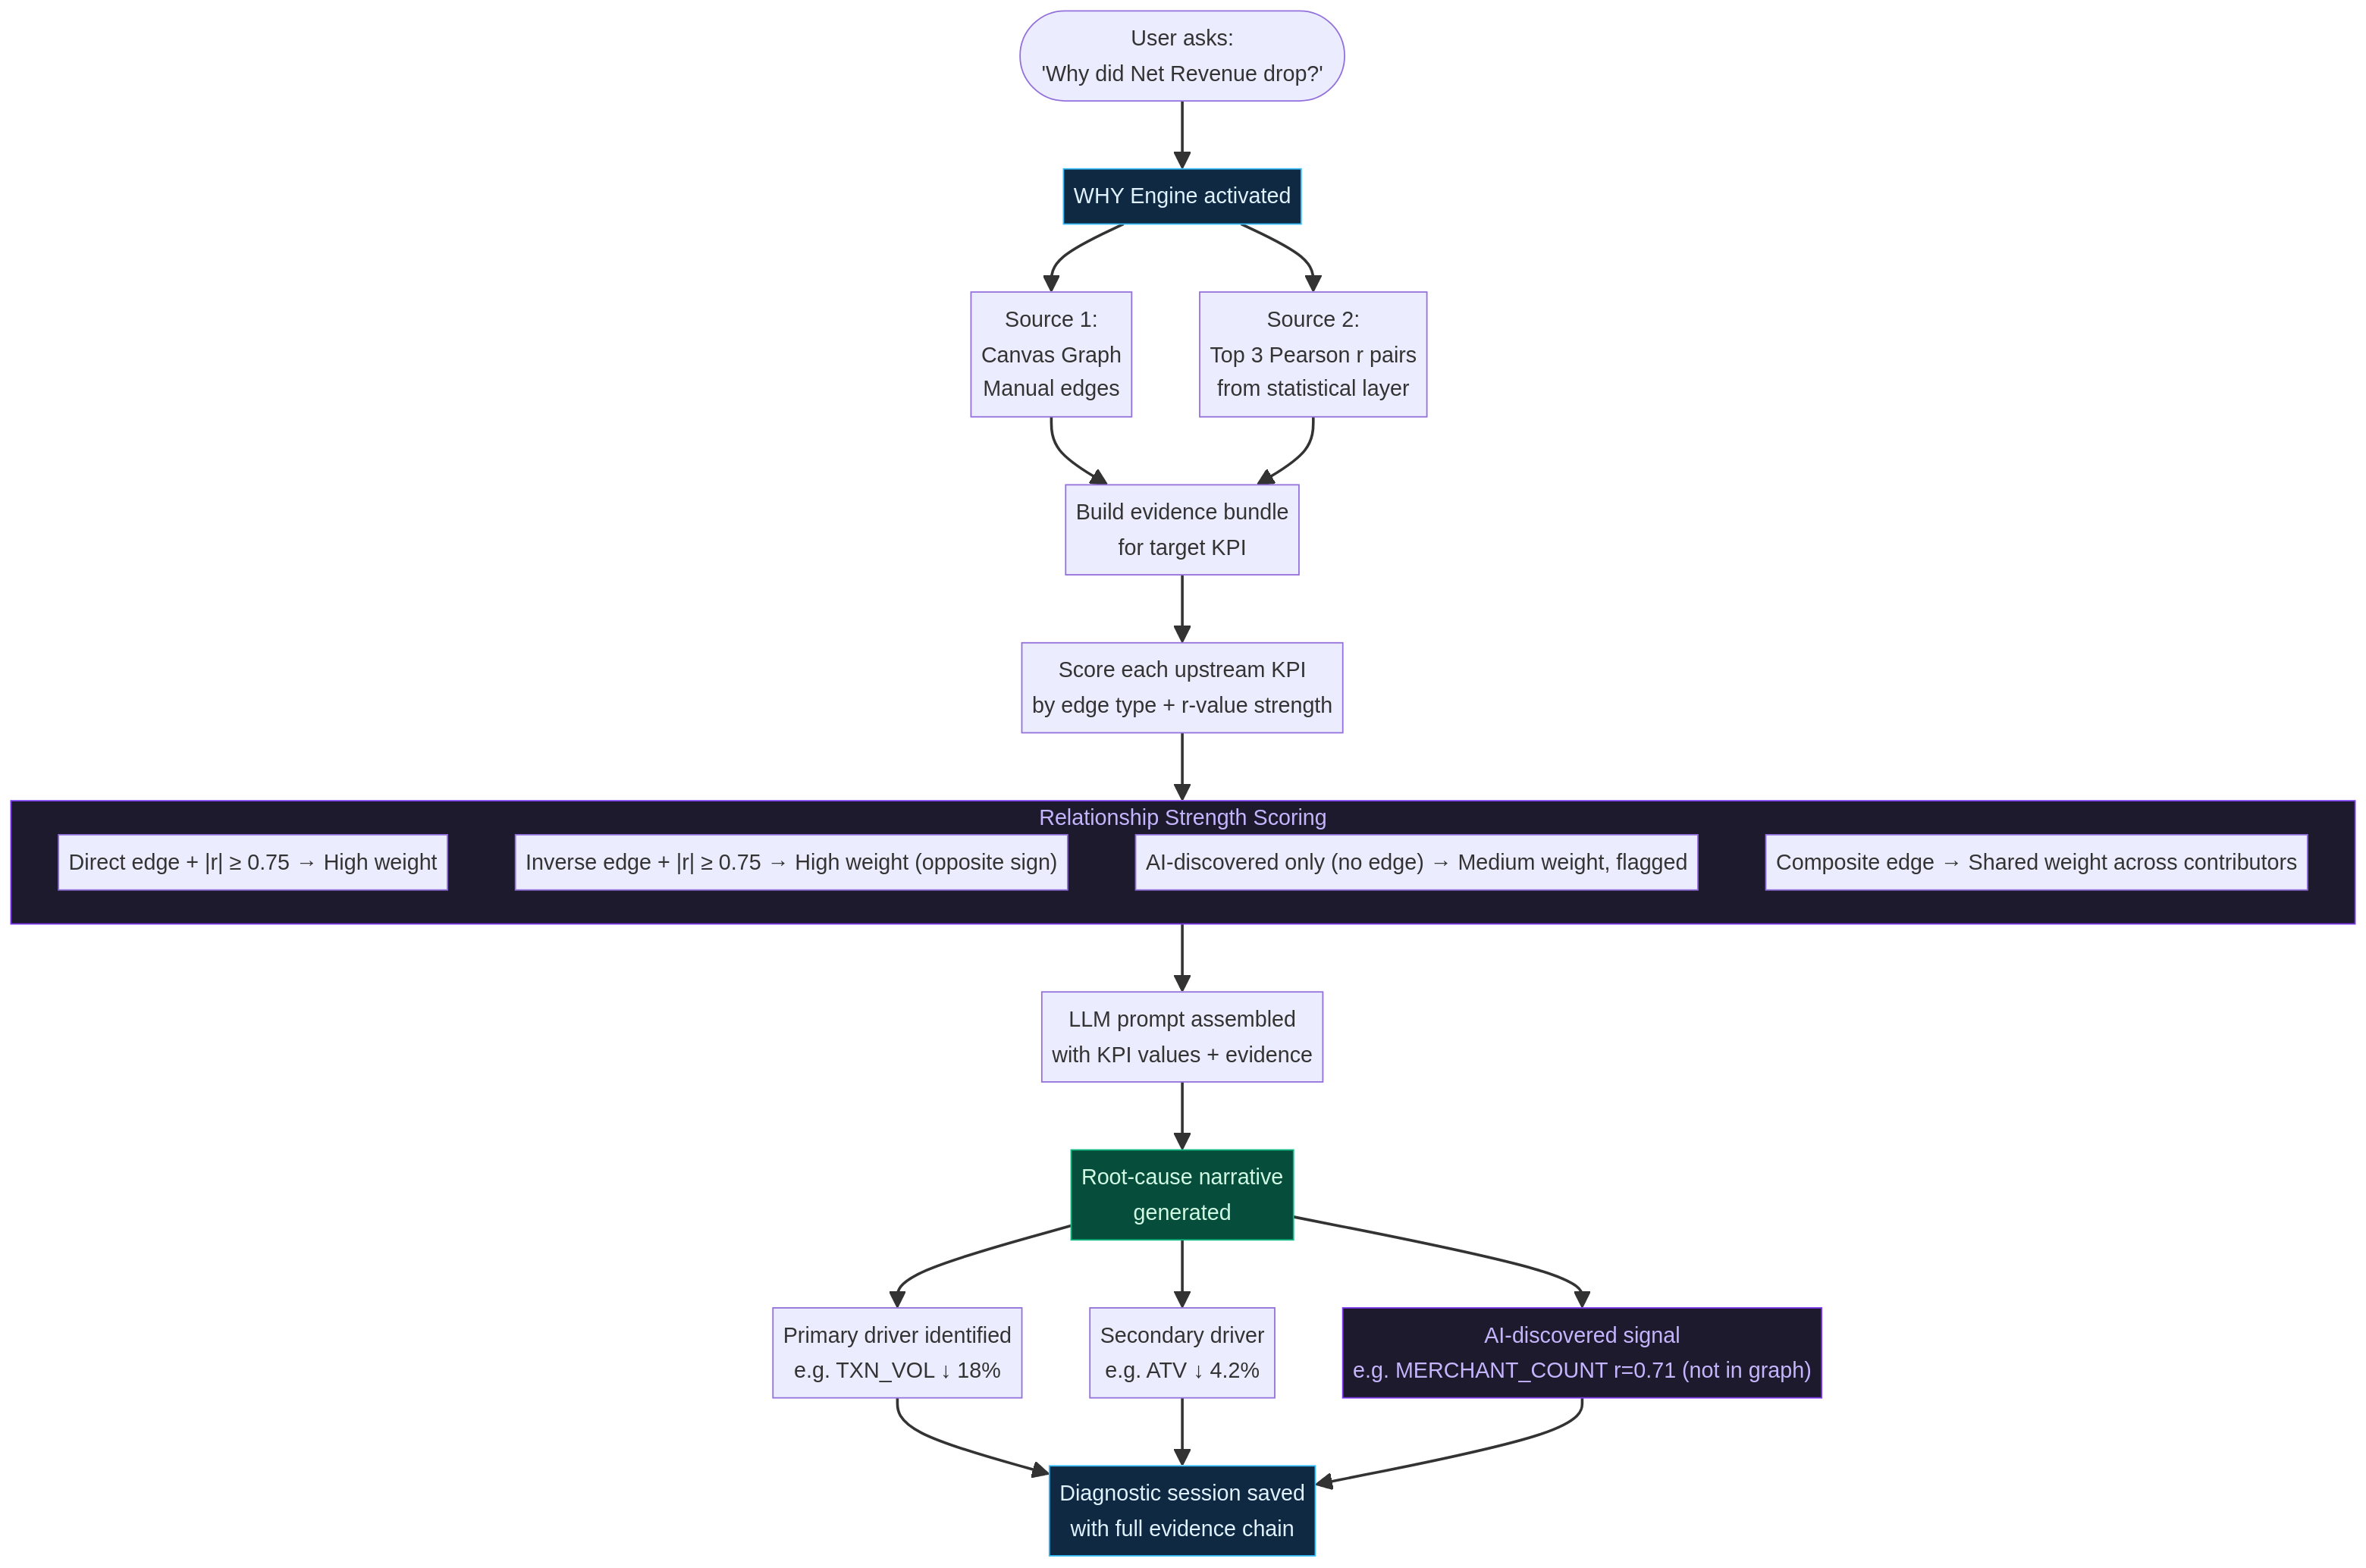
Discovering Pillars
Not all KPIs are equal in the graph. The WHY Engine classifies every KPI as a Pillar, Connector, or Leaf based on its structural position — and this classification directly changes the root-cause ranking.
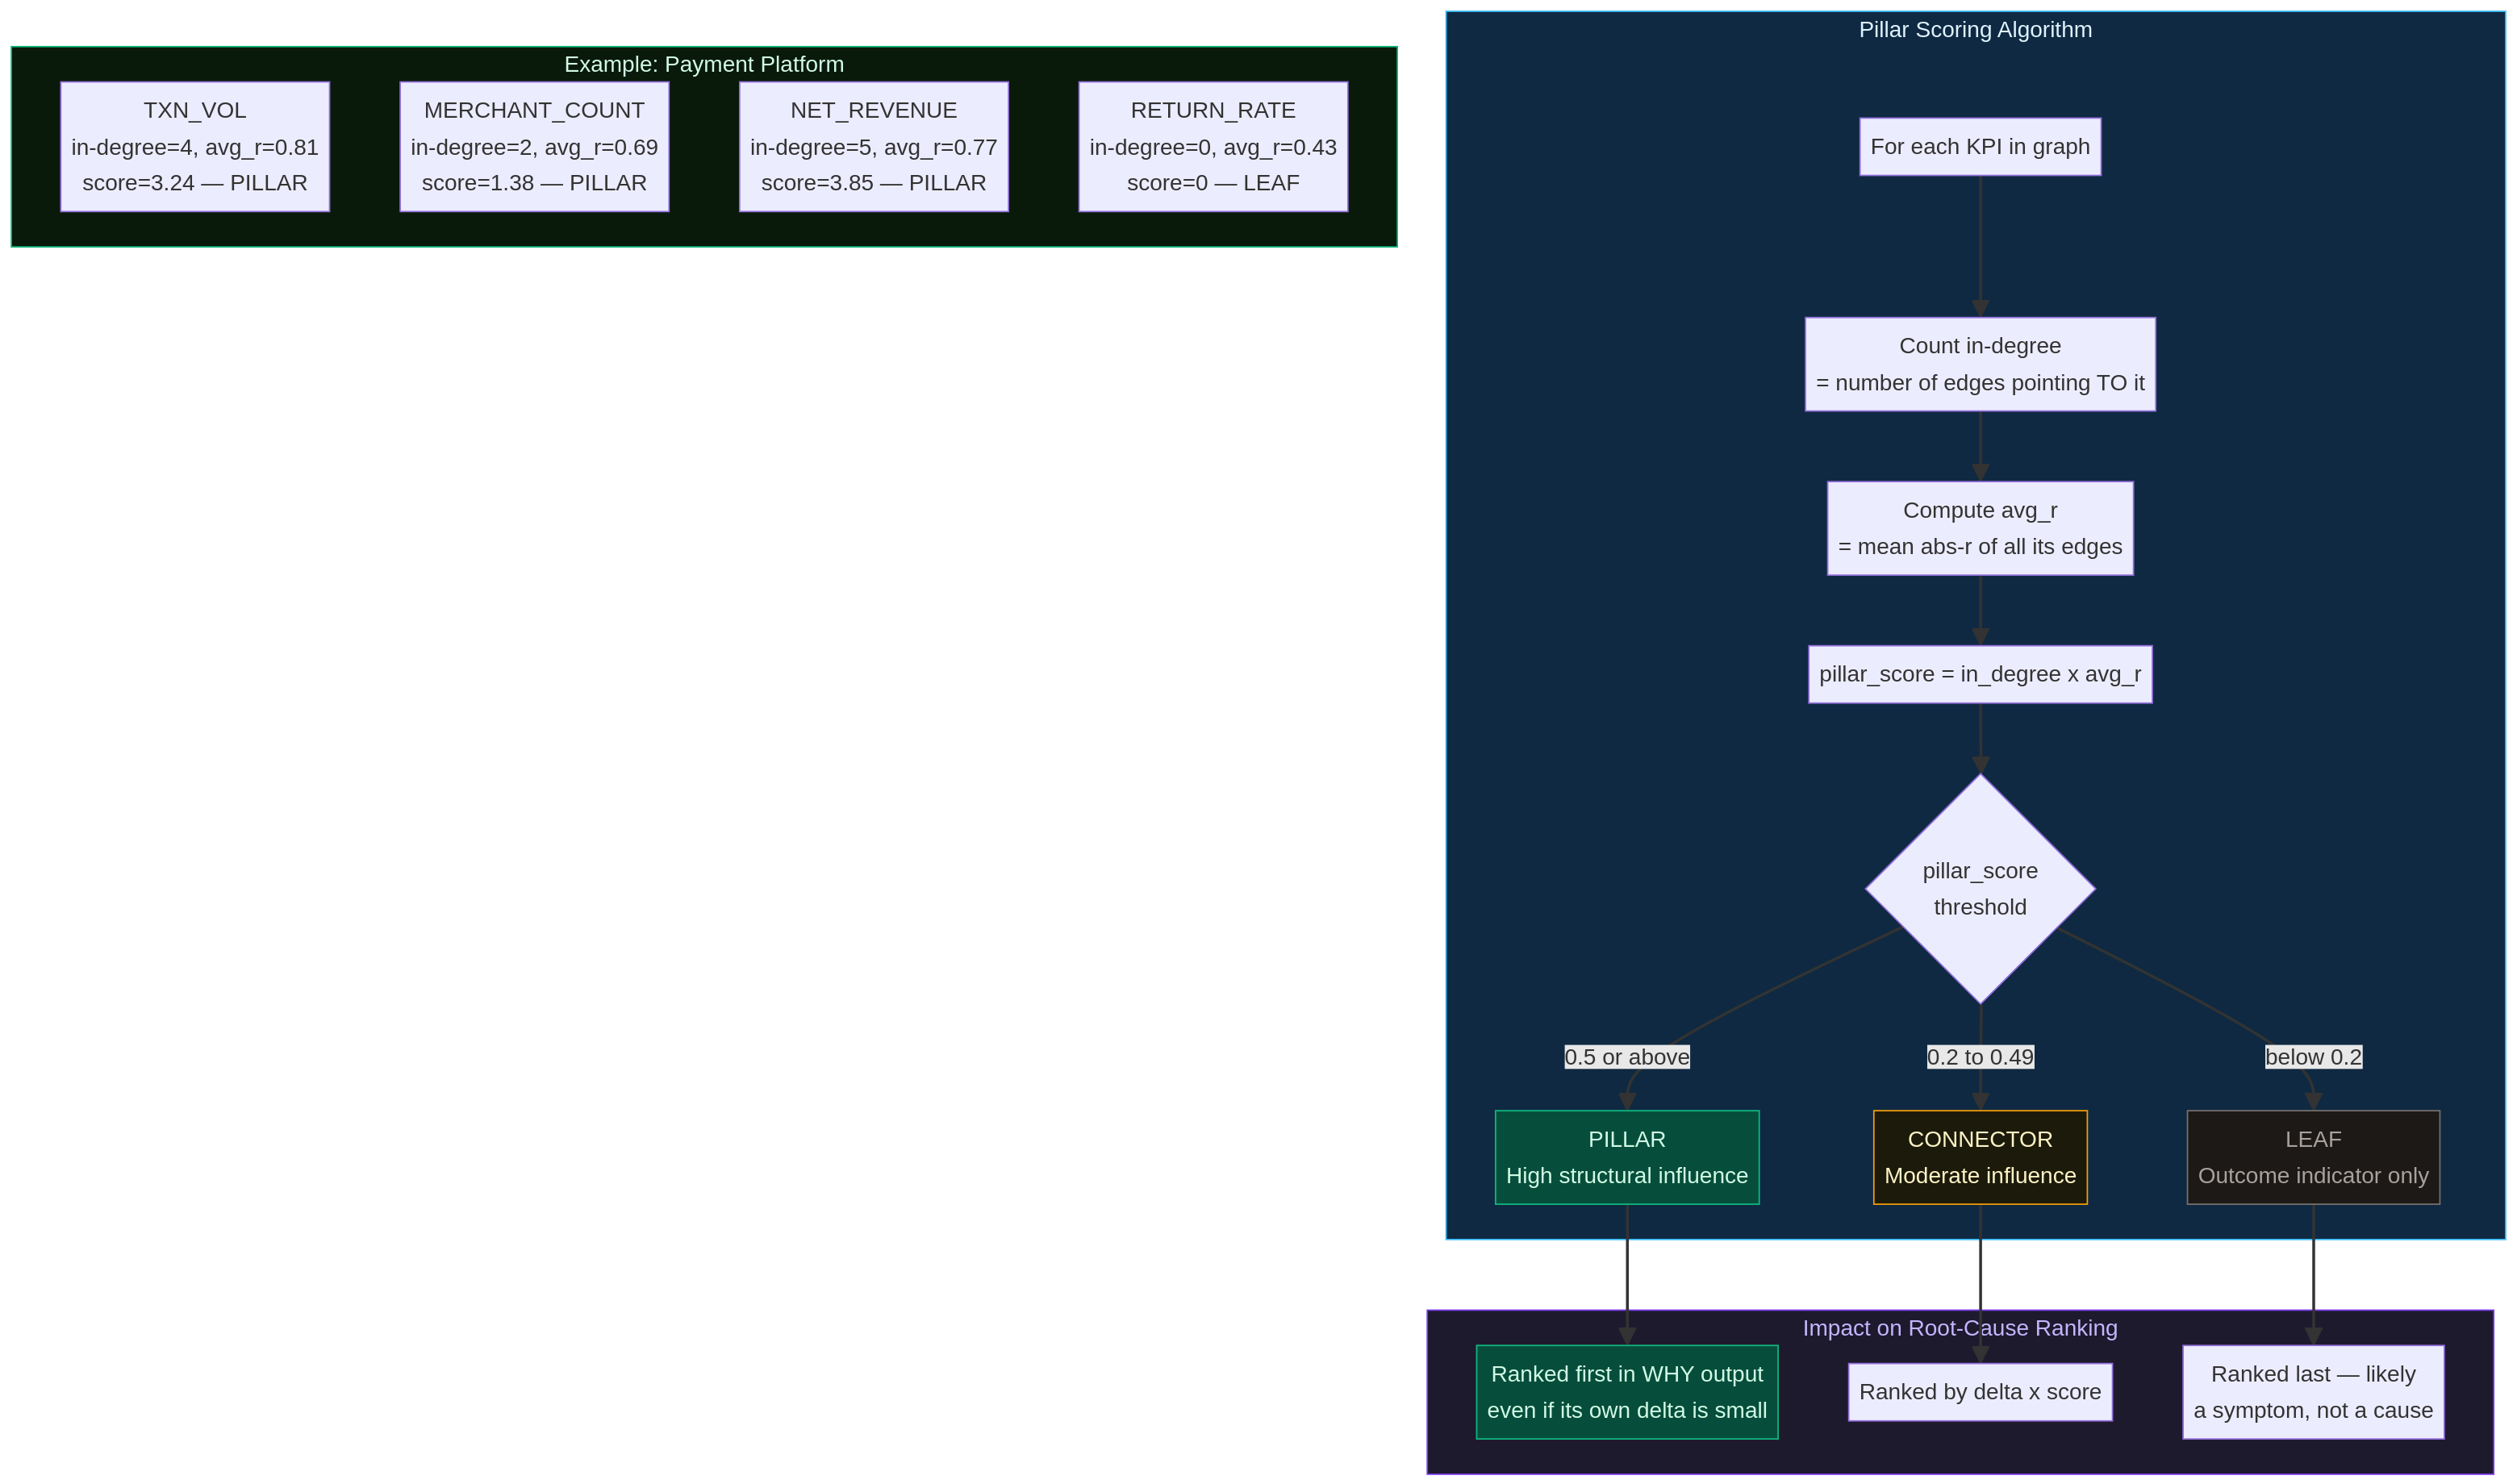
pillar_score = in_degree × avg_abs_rWhere in_degree = number of edges pointing TO this KPI, and avg_abs_r = mean |Pearson r| across all its edges.
The Full Intelligence Cycle
Manual linking and statistical discovery are not alternatives — they are complementary layers. Together they produce an enriched graph where every edge carries type, r-value, and lag metadata. That enriched graph is what makes the WHY Engine precise.
Performance View
The Performance tab shows each KPI's value over time with period-over-period comparisons, target attainment, and trend indicators.
- • Current value with unit (IQD, %, count)
- • ▲ +3.7% or ▼ -1.8% vs. prior period
- • Target attainment bar (if target is set)
- • Trend sparkline for the last 12 periods
Snapshots are computed monthly by the background job. Each snapshot stores the KPI value, period, and any anomaly flags. You can also trigger a manual snapshot from the Snapshots tab.
Iris AI Agent
Iris is InfotoIntell's AI assistant embedded in the KPI Intelligence Engine. It is grounded in your semantic layer — it knows your KPI definitions, formulas, relationships, and business context — and can answer questions, create EWS rules, and explain movements in plain language.